Predicting Global Food Insecurity
Exploratory data analysis and visualization of IPC Phase 3+ trends
Overview
A Python-based analysis examining global food insecurity trends by country and year, focusing on populations experiencing IPC Phase 3+ levels of crisis or worse.
Approach
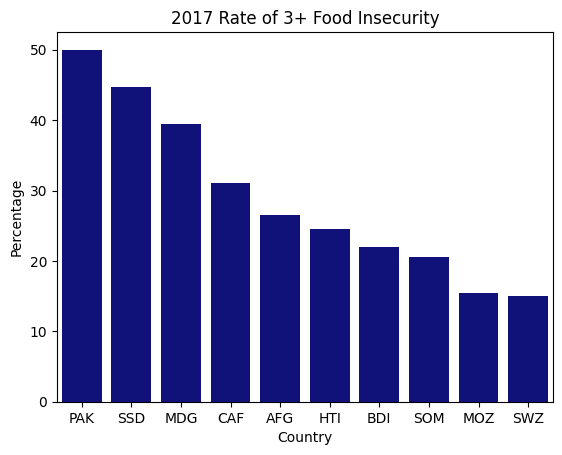
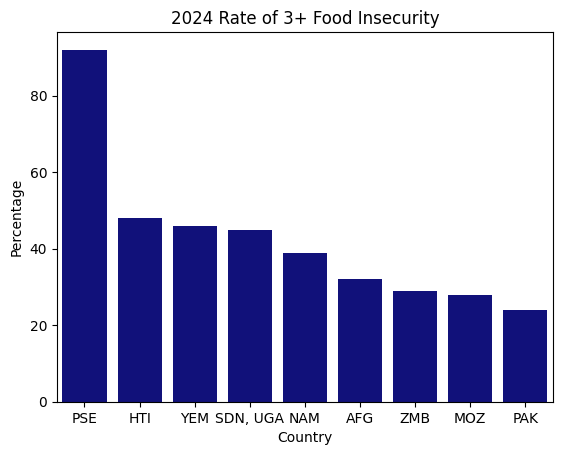
Cleaned and structured food insecurity data, computed average IPC Phase 3+ percentages per country-year, ranked countries to identify the top 10 most affected in 2017 and 2024, and visualized comparisons using horizontal and stacked bar charts. Leveraged pandas for data transformation and seaborn/matplotlib for visualization.
Outputs
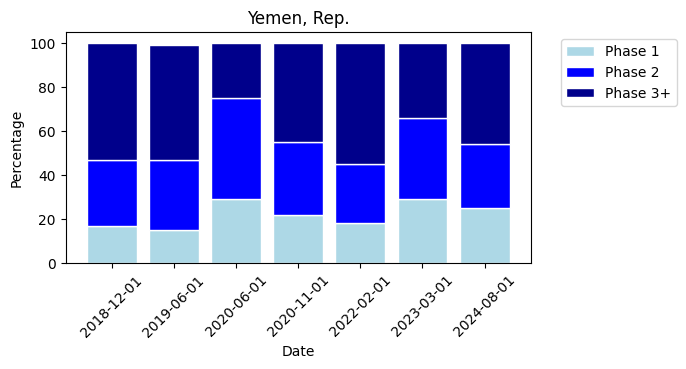
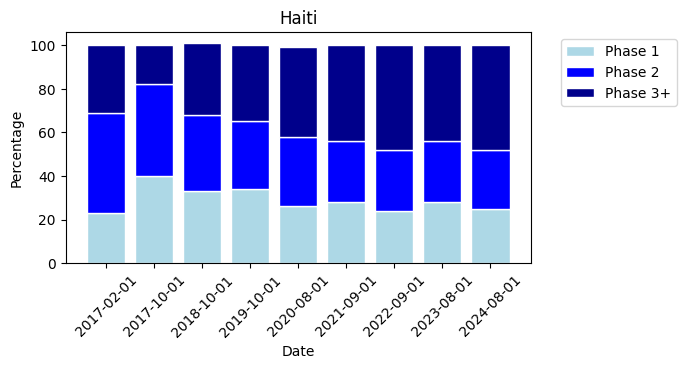
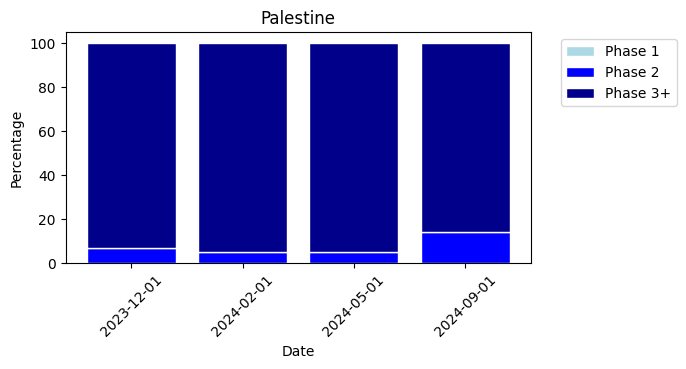
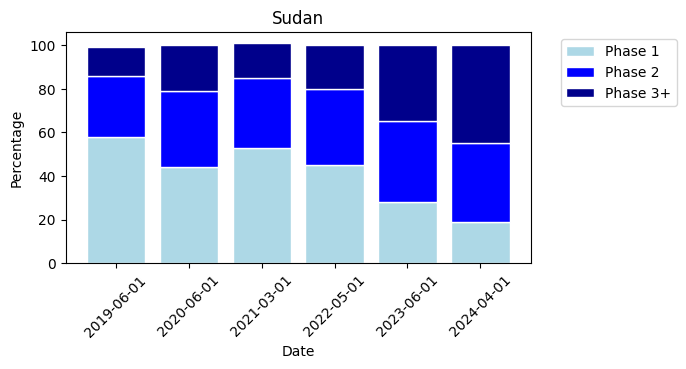
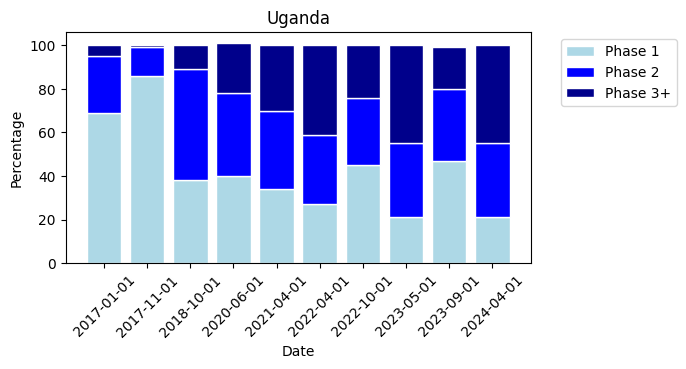
Horizontal bar charts comparing the top 10 most affected countries across two benchmark years, and stacked bar charts illustrating longitudinal changes in food insecurity phases for five selected countries.
Visualizations